There exists a super fine distributed medium called the aether, which allows for the propagation of electromagnetic waves through space. The aether is an integral component of all matter and energy. It is necessary for all physical processes and may even be regarded as the foundation substance for existance itself. The author's belief in the existance of an aether, does not differ greatly from pre-relativity cosmology that was accepted science before Einstein.
Please Note: After registering the website 'aetherwavetherory.com' and completing the research described here, the author discovered that the term 'Aether Wave Theory' was already in use to describe someone else's cosmological theory. No attempt is being made to lay claim to anyone else's work. The author of this paper entitled 'Aether Theory And Observations Involving Ultra Low Frequency Waves' does not claim to have originated a cosmology or 'Theory Of Everything', but has discovered phenomena, performed research experiments, recorded results and offers the theory presented here, about the aether and ultra low frequency waves.
I want to thank God for the gift of these discoveries and for His continually helping me, all of these years, or this research would not have been possible.
The scope of this paper is a theoretical explanation of observed phenomena involving Ultra Low Frequency waves, the Aether, the Barkhausen effect, the Hodowanec effect, the Schumann resonance and effects that the author calls the ULF E-Field effect and the Aether-Magnetic effect.
The theory in essence, is this: There exists ultra low frequency modulation of the aether or "aether waves", which are generated by an unknown natural source, that imprints upon (or modulates) the earth's natural electric and magnetic fields and also the AC power mains. These waves have shown that they can penetrate electric and magnetic shielding. These waves are believed to be scalar in nature. They are detectable by a number of means as described below. The "Aether-Magnetic" detector experiments performed below, have demonstrated that by forcing a magnetic (Barkhausen) detector to track these natural ULF waves, the Barkhausen detector is put in-phase with modulations of the aether caused by magnetic activity and very greatly improves sensitivity of the detector. This suggests speculation that it may be possible to modulate power generators with this natural ultra low frequency scalar wave activity, in such a way as to produce outputs with improved efficiency.
The author will detail a series of experiments that he has performed and the conclusions that he has drawn from them, to support his theory of ultra low frequency aether waves. To this end various experimental apparatus were built and comparisons were made to validate this theory.
The author will also make available to others, diagrams of his experimental apparatus and construction notes, as well as the virtual instrument programs that he has written and used in these experiments, so independent researchers may make their own investigations.
See bottom of this page to download author's research schematic diagrams, construction notes, software and complete documentation.
Ultra Low Frequency Aether Waves and the Hodowanec effect.
For the past few decades, physicist Gregory Hodowanec, has experimented with electronic capacitors, that when coupled to an amplifier circuit, could detect very low frequency signals, coming from outside of the circuit. If the author correctly understands Mr. Hodowanec's theory, he believes that these detected signals are gravitational waves and that they are scalar in nature and may even originate outside of the solar system.
Skeptics have argued that Hodowanec's circuits are actually just low frequency oscillators and also that they simply amplify internally produced circuit noise. The experiments below, disprove to a high degree, the skeptics arguments.
The author has observed ultra low frequency signals as anomalous fluxuations, in various sensitive circuits over the years, that did not appear to be generated by the circuits themselves as self-oscillation, nor did they appear to be the result of ambient temperature fluxuations or similar ordinary phenomena. In order to study the nature of this phenomenon, the author constructed apparatus for investigation. Many of Mr. Hodowanec's experiments had involved detecting signals in the audio range. The author however, was more interested in the frequencies well below audio, since the phenomena he had observed in circuits over the years, were fluxuations from 1 Hertz down to .01 Hertz.
For the sake of clarification, it should be noted that there is a question over the phrase "Ultra Low Frequency" (ULF) and "Extremely Low Frequency" (ELF) and which of these describes the range of frequencies in question here. In radio technology terms, frequencies below 1 Hertz are usually described as "Extremely Low Frequency" (ELF), but in geophysics terms, the frequencies below 1 Hertz are often described as "Ultra Low Frequency" (ULF). That is the term chosen here.
Description of the First Experimental Apparatus:
The first detector was a classic Hodowanec capacitor detector circuit using a large (4700 microfarad / 35V) electrolytic capacitor connected in the normal inverting amplifier /current to voltage configuration. An LF 347 J-FET op-amp IC was used and a 1 megohm feedback resistor was employed. The output of this amplifier was fed to a second op-amp stage of the LF 347 chip. The second amplifier stage was a non-inverting amp circuit with a gain of 7. The ouput of this stage was fed to signal conditioning stages and then to a combination analog to digital converter and USB PC interface circuit (Velleman VM-110 / K8055). Most of the experiments in this paper were performed using this Velleman VM-110 interface. The Velleman VM-110 and the detector circuits were powered (unless described otherwise), by the personal computers 5 volt power system. A small cmos negative rail generating IC chip was used to provide a minus power rail for the op-amps in the detector.
Software was written and compiled using the Abacom Profilab Expert 4.0 platform. The Abacom platform allows for personal computer interface with a number of external devices such as analog to digital converters and some multimeters. It also allows for the creation of virtual instruments with displays such as chart recorders, oscilloscopes and meters and it includes various math processing blocks. Most of the experiments in this paper, were performed with this type of setup, using virtual instrument programs written and compiled with the Abacom Profillab Expert 4.0 platform.
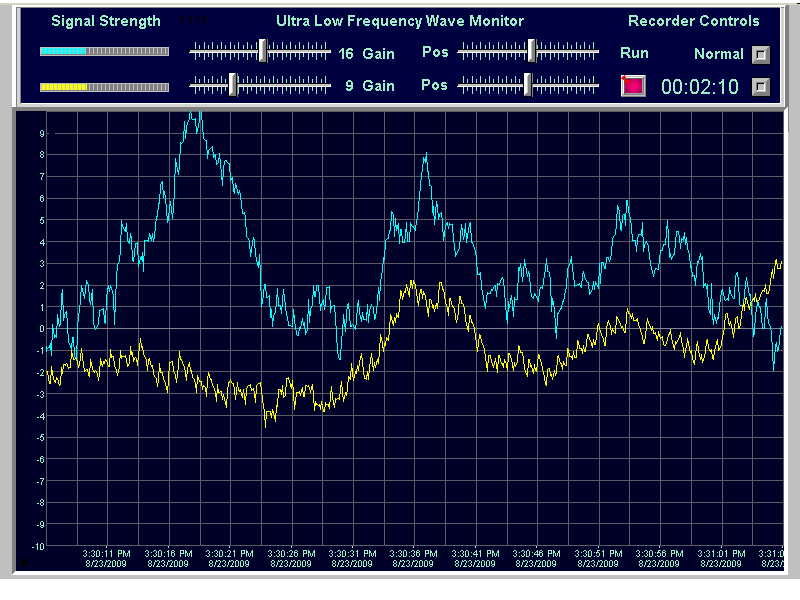
For the program used in the series of experiments for the first two detector types, a virtual, two channel chart recorder was chosen to display the amplified detector signal on the PC's monitor. This software is named the "Ultra Low Frequency Wave Monitor".
Experiment 1: With no special signal processing, the resulting display looked like, more or less, random low frequency noise.
Experiment 1A: With the addition of a virtual math block to the program (a mean value component with settings of: 0.1 seconds sample rate and 70 samples/mean value), detected ultra low frequency waves became visable. The displayed waves were sine wave like, several seconds in duration and varied in amplitude and frequency. Initially, the waves seemed to be random, but various combinations and sequences were seen repeating. Different settings of the mean value math block (different sample rates and number of samples per mean) were tried, but the values above seemed to give the cleanest extraction of the detected signal. The detected waves did not look like random noise that was simply being shaped into waves by the mean value processing.
Experiment 2: The capacitor detector circuit was placed in a grounded steel box for shielding and the detected waves were still present.
Experiment 3: A second, identical circuit was built and installed on a second personal computer located across the room. The same virtual instrument program was installed onto the second computer and both test setups were run at the same time. Both computer monitors displayed very similar, but not perfectly tracking waveforms. Differences are believed to be caused by different location and positioning of detector capacitors and by the non-synchronized nature of the two computers each running the mean value math processing (each with a different starting point for the mahematical processing). Common patterns could still be seen. By repositioning the capacitor detectors slightly, waves could be seen to more accurately track each other.
Experiment 4: New experiment: Feeding two identical detector circuits to a single personal computer. Since the Velleman VM-110 analog to digital PC interface is a two channel device, it was possible to feed two of the above described capacitor detectors to a single PC via the VM-110. The software program has two channels of input, that might be identically processed and displayed on the virtual chart recorder. The two ultra low frequency waveforms tracked fairly closely. Sometimes one waveform would be 180 degrees out of phase with the other, but the actual wave shapes would mirror each other closely.
Experiment 4A: Configured one of the detectors with a capacitor of 4700 microfarads, the other detector with a capacitor of only 470 microfarads. Waveforms still track each other well enough to not be considered as random noise. This two capacitor of different sizes test also proves that what is being witnessed here can't be self-oscillation or one waveform would have to be several times (ideally ten times) the frequency of the other.
Experiment 5: Using the personal computer's sound card as an input from the capacitor detector, and with a similar program to those used before. Again, the ultra low frequency wave was seen. Tried a new dual channel test setup with the sound card input on one channel and the Velleman VM-110 on the other. Waves still tracked noticeably well. (The software used in this experiment was a special variation of the program used in the previous tests, to accomodate the sound card input).
These tests demonstrate that the detected waves are not the result of self-oscillation of the detecting circuits. The new experiments below, also confirm this.
Ultra Low Frequency Aether Waves and the ULF E-Field effect:
Experiment 6: While experimenting with the Hodowanec capacitor detector described above (using the first experimental apparatus with the VM-110 interface), various capacitor values were tried. Amplitude of the signal detected, seemed greatest with larger capacitors, though it appears that the capacitor's physical size is more of an important factor than the microfarad value. At one point a tiny .1 microfarad monolythic ceramic capacitor was tried. Almost no signal was seen.
Experiment 6A: A vertical wire "antenna" of about 7 feet long was then connected at the .1 microfarad capacitor's connection with the input of the op-amp. The detected signal was quite substantial. The detected signal was sometimes a perfect sine wave, sometimes a very distorted sine, often a repeating set of "W" and inverted "M" shapes. The wave duration and frequency varied from one wave every few seconds down to less that one wave per minute.
Experiment 6B: The end of the "antenna" wire was then connected to a metal grid of heavy wire construction, of 2 feet X 4 feet. This grid was actually an insulated top shelf of a welded wire storage shelf system. This improved the signal amplitude considerably.
Experiment 6C: The .1 microfarad capacitor was then removed and the antenna was left connected to the op-amp input. The signal was noticeably reduced in amplitude and clarity, so the .1 microfarad capacitor was reinstalled.
Experiment 6D: A few different small capacitor values were tried (with this antenna setup) to see how they effected the detected waves: .4 microfarad gave excellent lowest frequency response. .1 microfarad seemed just as good. .01 microfarad almost as good with a little more higher frequency noise present. .001 microfarad did not seem to do anything (acted like no capacitor was in the circuit). .1 microfarad was chosen as a comparitive optimum.
Experiment 7: Constructed a two channel variation of this ULF E-field effect antenna circuit. Connected two separate but identical antenna setups (with .1 microfarad capacitors), as described above, one to each of the two identical detector circuits and input both circuits to a Velleman VM-110 analog to digital PC interface. Used the dual channel virtual chart recorder program, which processed each channel in the identical manner. Displayed results showed the waveforms tracking almost perfectly.
Experiment 8: To prove that what being seen is not some type of software shaping of random noise. The output of an ULF E-field effect antenna circuit was fed to the Velleman VM-110 analog to digital PC interface as before, but was also fed to a PC based transient recorder. This device is a PC scope interface product (not part of the author's software). This PC based transient recorder (chart recorder display) was installed on a different personal computer from the one running the author's custom software (The separate PC even had a different operating system). Note that no software mathematical processing (mean value math blocks) were used in the PC based transient recorder device. Both computers and their respective programs were run simultaniously. Waveforms on each computer's monitors, tracked in real time.
Experiment 9: To compare simultanious operation of a Hodowanec 4700 microfarad type detector and an ULF E-field effect antenna circuit detector.
One of each type of detector was input to the Velleman VM-110 analog to digital PC interface. The dual chart recorder program had separate adjustable virtual gains for each channel (The capacitor detector requires a higher gain), all other signal processing and math blocks were identical. Waveforms showed very definite commonalities and tracking. The ULF E-Field effect antenna circuit detector showed a dominance of the lowest frequency waves, while the Hodowanec type detector, displayed some waveshapes that were more detailed in higher frequencies, but the relationship between both waveforms could clearly be seen.
Experiment 10: To confirm that the detected signal was not coming from the negative rail generator cmos IC (a tiny switching power supply IC chip), or the computer power supply, the rail generator IC was removed and both the positive and negative 5 volt power rails for the detector circuit, were supplied by 9 volt batteries connected through 78L series five volt regulators, to supply the 5 volts positive and 5 volts negative to power the op-amps. The ultra low frequency waves were still detected as before.
Experiment 10A: In order to prove that the detected signal was not generated by the personal computer or the VM-110 interface, A ULF E-field effect antenna circuit detector's analog (first op-amp stage) output was connected to the PC scope based transient recorder as in experiment 8, but this time no Velleman VM-110 interface or second computer and software was used. The detector was now powered by a separate DC power supply, not receiving its power from the computer power bus as it had in all previous experiments (except experiment 10). It was now necessary to connect the power ground to earth ground, to get a good signal, but the ultra low frequency waveforms could be seen on the transient recorder.
Ultra Low Frequency Aether Waves and The Barkhausen Effect
Ferromagnetic metals possess atomic level magnetic domains as discovered by Heinrich Barkhausen in 1919. Upon exposure to slowly changing magnetic fields, these magnetic domains generate discrete pulses. These pulses may be induced into a coil of many turns of insulated copper wire wound around the ferromagnetic core (such as a conventional assembly of sheet type power transformer/ inductor laminations). This phenomenon is called the Barkhausen Effect.
The number of Barkhausen effect pulses generated by a detector, over a period of time, is proportional to the number of atomic level ferromagnetic domains contained within the detector and the total amount of magnetic activity within the space occupied by the detector mass. The Barkhausen pulses may then be integrated into an analog voltage that is proportional to an averaged value of the total amount of change activity in the magnetic field over time.
Effectiveness of shielding placed between the magnetic activity source and the ferromagnetic domain (Barkhausen detector), will normally be proportionate to the density of ferromagnetic domains in the shielding. The greater the density of ferromagnetic domains in the shielding, the more the detected activity will be reduced at the point of detection.
Description of the Second Experimental Apparatus:
Please Note: The Aether-Magnetic detector apparatus used in the following experiments 11 through 14 was first used by the author at a lab located out in the country, where the magnetic polution common to cities, was not a problem. A duplicate set of tests was performed at another location about 60 miles away, but also out in the country, with very similar results. The author then moved to a city (in southern California) and found the ambient AC magnetic fields to be much greater. It is not uncommon to have a 1 to 3 mG field everywhere in a typical house. This makes the high sensitivity variation used in experiments 11 and 12 (0 to 0.1mG), imposible to repeat in a high AC magnetic ambient environment of a city and may even cause some problems with the low sensitivity variation used in experiments 13 and 14 (0 to 1.0 mG). For experiments 13 and 14, it may help to position the detector transformer on its side or end in order to limit the pickup of the ambient AC magnetic field.
The Aether-Magnetic Detector apparatus, built by the author, used in the next series of experiments, is detailed below:
A standard commercially available frame type power transformer with a 110 volt AC primary and a secondary rated at about 50 watts (24 volts / 2 amps), was used as a Barkhausen detector. The primary was used as the output, secondary not used (except in Experiment 13 below). This large transformer was used because of the large core mass, which provides greater sensitivity than a smaller transformer. (The number of ferromagnetic domains being proportional to core mass, for a given material and therefore to the number of Barkhausen pulses that will be generated). The transformer chosen had a metal electrostatic shield. It was found that the detector seemed to produce cleaner signals when this metal shield was connected to electrical ground. All experiments were conducted with the electrostatic shield grounded.
The transformer was AC coupled to an LF 444 ACN JFET op amp circuit of high gain, through a large electrolytic capacitor (1000 microfarad). This capacitor not only provides AC coupling to the Barkhausen detector coil, it also functions as a scalar / aether wave detection element that provides a great improvement in sensitivity in the Barkhausen detector. The theory of operation of the capacitor in this circuit, is that it provides an ever-changing bias to the Barkhausen detector which is synchronized to the naturally occuring, scalar ULF wave. This puts the Barkhausen detector in-phase with modulations of the aether caused by magnetic activity.
The amplifier configuration was as follows: The op amp's non-inverting input was connected to ground. The inverting input was connected to output by a 1 meg ohm feedback resistor. The inverting input was also connected to one side of the 1000 microfarad capacitor. The other side of the capacitor was connected to one lead of the "detector" transformer's primary winding. The other lead of the transformer's primary winding was connected to ground. The first amplifier stage was fed to a second stage simple non-inverting amplifier with a fixed gain of 70. The pulse output of the amplifier circuits was summed into a proportional analog voltage by a schottky diode a small electrolytic capacitor (10 microfarad) and a load resistor across the electrolytic capacitor ( 20K ohms).
This varying voltage output was then fed to a Velleman VM-110 analog to digital converter and USB Interface module, (identical to that described in experiment 1 above), that connected to a personal computer via the USB interface.
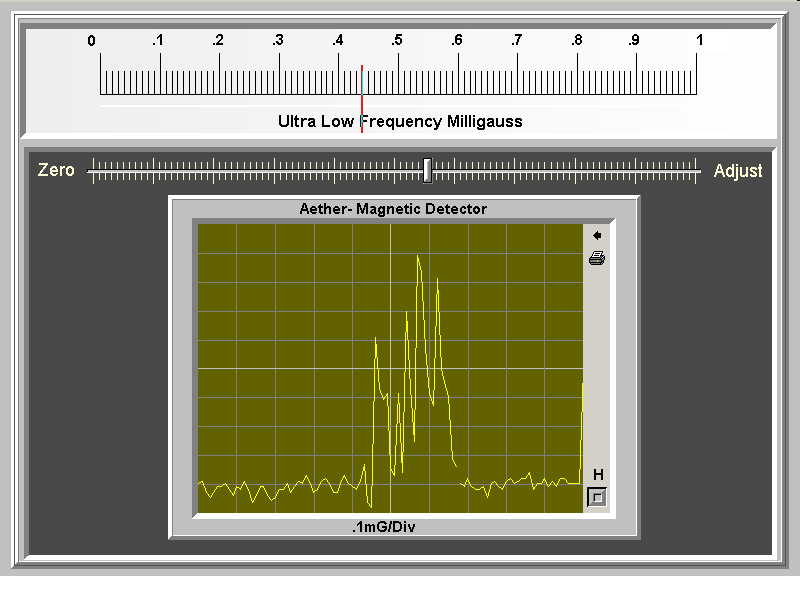
The Aether-Magnetic Detector Virtual Instrument Software:
A custom written software program displayed virtual storage oscilloscope and meter on the computer monitor. This program was written and compiled on Abacom Profilab Expert 4.0 platform. A virtual math block mean value component like those used in the electric and capacitor experiments above, was used on the virtual analog meter (this time with a setting of: 0.1 seconds sample rate and 10 samples/mean value). No mean value math block component was used on the virtual oscilloscope. The program also had a "Low Range Sensor / High Range Sensor" switch, which simply changes the virtual meter scales to that which is appropriate for the particular magnetic detector circuit being used (no changes in virtual gain are performed in the program). For this series of experiments, the "Low Range Sensor" scale sellection was used. The software used in this experiment was called the "Aether-Magnetic Detector".
The sensitivity of this instrument was roughly 0 to 0.1 Milligauss full scale, on the virtual meter and 0.01 Milligauss / division on the virtual oscilloscope display.
To provide a source of ultra low frequency magnetic field, two techniques were used: A small power transformer was used as an AC field source, by driving it's primary winding with a low output, low frequency laboratory type signal generator. The generator was used to provide sinewave frequencies of 1 HZ to 60 HZ. Most of the experiments were performed simply with a stack of four, one inch diameter ceramic magnets, of the type sold in hobby and electronic stores and by rocking them back and forth while holding them between index finger and thumb. The magnets were used to provide frequencies of 0.1 HZ to 4 HZ. These sources while not of calibrated precision, allow for simple comparitive tests.
Experiment 11: Magnetic activity detection and shielding experiments, a variety of shield materials were used: soft steel sheets, Industrial electrical utility boxes, aluminum sheets, concrete blocks and bricks, plywood, plastic and other non-metalic materials. Results were as follows: All non-ferris shielding did very little to reduce sensitivity. Steel and other magnetic alloys reduced sensitivity to varying degrees, depending on the thickness and the magnetic qualities of the shielding. In many cases this detector seemed to "see" right through even steel shielding.
Observation 11A: Due to the extreme magnetic sensitivity of the detector and its amplifier, it was necessary to locate the test setup away from those shop walls which contained power wiring. Even AC power wiring running through steel conduit, could interfere with experiments.
Observation 11B: Barkhausen detection of ultra low frequency magnetic modulations of the aether (aether-magnetic waves), in terms of distance, seems to indicate conformance to inverse-square law.
Experiment 12: A very definite ultra low frequency fluxuation of the virtual meter and ocsilloscope could be seen in the ambient random noise being detected. It was discovered that when the detector "transformer" was moved closer to the lab's AC power wiring (or near any plugged in appliance), that the ultra low frequency fluxuation grew much stronger. This shows that the ultra low frequency wave is impressed upon the AC power grid as well.
Experiment 13: Performed to investigate the effect of the static ambient magnetic field upon the Barkhausen detector.
Description of the Third Experimental Apparatus (Minor Variation):
To perform this experiment the secondary amplifier stage gain was reduced to 7, producing an instrument with a full scale sensitivity of 1 Milligauss. Otherwise, using the same test setup described above but this time the normally unused detector transformer's secondary winding was used as a means of providing an internal magnetic field. The 24 volt secondary winding was connected in series with a 30 ohm power resistor and a 14.4 volt battery. That provided a current through the secondary winding of 420 milliamps DC. The resulting magnetic field was measured using an Alphalabs DC Milligauss meter, on the exterior of the transformer. The field measured on that surface was over 2000 mG (2 Gauss). It is assumed that the field present within the core must have been even higher.
The Aether-Magnetic Detector Virtual Instrument Software:
The same software was used as described in the last series of experiments, above. The program has a "Low Range Sensor / High Range Sensor" switch, which simply changes the meter scales to that which is appropriate for the detector circuit being used (no changes in virtual gain are performed in the program). For this series of tests, the "High Range Sensor" scale sellection was used.
The sensitivity of this instrument was 0 to 1 Milligauss full scale, on the virtual meter and 0.1 Milligauss / division on the virtual oscilloscope display.
The detector was then tested for its sensitivity to a permanent magnet shaken in hand, a few feet away. This test was performed with and without the electromagnetic field turned on. The results showed no difference in sensitivity to the magnet (measured at 1 mG at the detector, using the Alphalabs meter with the experimental field power turned off ). This shows Barkhausen Effect pulses generated in ferromagnetic domains are produced irrespective to the local ambient DC static magnetic field.
Experiment 14: (Performed with the powered secondary winding of the last experiment now disconnected). Moving the Barkhausen detector in open space, causes Barkhausen pulse generation due to the following two theorized phenomena:
(14A) When the detector is moved, the detector itself, being made of ferromagnetic metal, causes generation of localized aether-magnetic waves, which are detected and translated into Barkhausen reactions in the ferromagnetic domains that occupy the space where that activity is taking place at the time.
(14B) The barkhausen pusles generated by simply moving the detector in open space also may be the result of the domains reacting with the earth's magnetic field (which may be up to 500 Milligauss) as the change of angle and position, would in theory, change the "bias" preconditioning of the domains within the detector and therefore generate pulses.
Experiment 15: Performed to investigate the ultra low frequency wave impressed upon the AC power mains. A new apparatus variation was built to study the powerline induced magnetic ULF wave and to compare it with the ULF E-Field effect detector wave:
Description of the Forth Experimental Apparatus (Variation):
(This experiment used a setup almost identical to the one described in Experiment 9).
Two detectors were used:
One detector consisted of a ULF E-Field effect antenna type detector as described previously.
The other detector consisted of the same circuit as described previously for the Hodowanec / Capacitor detector, but with only the following modification: The 4700 microfarad detector capacitor was replaced with a 470 microfarad capacitor connected in series with the primary winding of a standard commercially available frame type power transformer with a 110 volt AC primary and a secondary rated at about 50 watts (24 volts / 2 amps), (this is the same type of transformer used in the previous magnetic experiments) The secondary was not used. The detector transformer had a metal electrostatic shield which was connected to ground.
Both detector circuits were configured with all other components and op-amp gains identical.
One of each type of detector was fed to the Velleman VM-110 analog to digital PC interface. The dual chart recorder program used was the same one as used in Experiments 4, 7 and 9. Both channels of the virtual instrument were processed with the mean value math block (with identical settings).
A small 12 volt / 1 amp, unshielded power transformer was used as an AC powerline field source for the magnetic system. Its primary was plugged into AC power and its secondary was not connected to anything. it was positioned about 12 inches away from the detector transformer.
Please Note: experiment 15 was first performed in the quiet AC magnetic environment of a country lab site. It was performed again in a city with its associated high ambient AC magnetic activity. In the city, it was found that the powerline field source transformer described above, was not needed at all and the ambient pickup of the Barkhausen detector transformer, anywhere in the room, was all that was needed.
The same antenna setup was used for the ULF E-Field effect antenna type detector, as described in Experiments 6A,B and C.
Observations: Both the ULF E-Field effect antenna type detector and the new Aether-Magnetic detector, displayed ULF waves on the virtual chart recorder, that tracked remarkably well. Often, the waves would be 180 degrees out of phase with each other and there were other characteristic differences, but it was always obvious that both waves were being shaped by the same source.
Ultra Low Frequency Aether Waves and the Schumann Resonances:
Predicted mathematically in 1952 (and later confirmed by detection), by physicist Wilfried Otto Schumann the Schumann Resonances are a set of spectrum peaks in the extremely low frequency portion of the earth's electromagnetic field spectrum.
The Schumann resonances are caused by total world wide lightning activity, producing pulses that propagate in the space between the surface of the earth and the conductive ionosphere. This space acts like a natural waveguide and resonant cavity. The dimentions of the earth determines the frequency of this resonant cavity. The fundamental frequency of this cavity, has a wavelength equal to the earth's circumferance, giving a frequency of about 7.83 Hz.
This 7.83 Hz is the highest intensity Schumann resonant frequency. Higher frequency modes are of lower intensity and are about 6.5 Hz apart Notable peaks are at frequencies (more or less) of 7.83, 14.3, 20.8, 27.3 and 33.8 Hz. The eighth overtone is 59.9 Hz.
Lower frequency modes seem to have been of less interest to those who study Schumann, for some reason. But 7.83 minus 6.5 Hz gives 1.33 Hz.
Traditional equipment to study Schumann resonances is determined by whether one wishes to detect the electrical or the magnetic component of this activity. To detect the electrical component, a ball or similar type massive antenna is used to feed a very high impedance amplifier. To detect the magnetic component, a large coil wound around a very high permeativity core is used as a detector. Usually, a number of stages of active filtering is used to extract the signal from the ambient noise.
The frequency range of the Schumann resonances is for the most part, far above the frequencies being studied in this paper and is mostly outside the frequency range of the apparatus described here. What is interesting here, is that a ringing comb of spikes, with a frequency of about 1.3 Hz can be seen "riding" on the ultra low frequency waveforms using the ULF E-Field effect (electric) or Aether-Magnetic detectors, in the experiments above, using the virtual chart recorder software. The question is: Are these spikes Schumann resonances?
Conclusions and Speculations at this point:
(1) Both the Hodowanec type capacitor detector and the author's ULF E-field antenna detector, detect closely related ultra low frequency signals.
(2) The ULF E-field antenna detector circuit shows that these waves are present as a modulation of the ambient electrical field.
(3) The capacitor detector shows that these waves are also able to penetrate electrostatic shielding and create electrical wave activity inside the capacitor. This would indicate a form of energy other than transverse electromagnetic waves and may fit the criteria of scalar waves.
(4) The Aether-Magnetic detector configuration used on both the ULF Wave Monitor setup and the Aether-Magnetic Detector setup, works on the theory that the capacitor (in series with the Barkhausen detector coil) in this circuit provides an ever-changing bias to the Barkhausen detector which is synchronized to the naturally occuring, scalar ULF wave. This puts the Barkhausen detector in-phase with modulations of the aether caused by magnetic activity and thereby increasing sensitivity greatly.
(5) In the "ULF Monitor" variation, the detected ULF magnetic wave is seen to closely track the ULF wave detected by the E-field detector.
This commonallity shows that these waves imprint themselves upon (or modulate) the earth's electrical field, magnetic field and have a scalar characteristic as well.
(6) It is the author's theory that these waves are of aetheric nature and are part of the natural processes of our planet or solar system.
The repetitious / continuous nature of (some of) these detected waves, suggests that this is not from a single or group of single events, such as an exploding star, unless from some kind of pulsar or other extrasolar pulsing source. This continuous detectable modulation of the earth's electrical and magnetic fields, also suggests that this is more likely a local phenomenon from within our solar system. It is reasonable to conclude that the detected waves are from the sun or are the result of some natural interaction between the earth and the sun. However, new tests performed recently and involving longer chart recordings, show an increase in some of the detected energies, during night time hours. This indicates that some of the detected energies are of galactic origin.
Future Experiments:
Up to this point, no experiments have been performed, to find whether the ultra low frequency waves are imprinted on phenomena, other than those described above. Care must be taken to avoid false readings due to the electrical, magnetic and scalar ULF wave influences in the experimental apparatus itself, being perceived as coming from the quantity being measured. This is especially true, due to the scalar aspect of the ULF wave, which makes it hard to isolate apparatus by shielding.
Apparatus Notes, Credits and Disclaimers:
(1) It was discovered that some large (4700 microfarad) capacitors, have too large a leakage to work properly. Try another one if things don't work well.
(2) It takes several seconds for the large electrolytic capacitor to "form' properly and start working. This is especially true when you power up the detector circuit for the first time.
(3) It was also discovered that in the large capacitor detector front end application, LF347 IC's may not all give satisfactory performance. The author suggests that builders buy several LF347 IC's and put a socket on their circuit board to try different devices if needed.
(4) In any circuits where the LF444ACN IC chip is called for, try to get the actual "ACN" version, not the LF444"CN" version. The CN version is not as accurate or repeatable as the ACN version, though it will work. Digi-Key has the LF444ACN device.
(5) The Velleman VM-110 / K8055 interface board has a jumper setable USB address selection of addresses 0,1,2 or 3. The builder must set the address jumpers to address 0, as that is how the author's software was configured.
It is the author's hope that some who read this will be interested in doing research into this ultra low frequency wave phenomenon. The author has provided schematics of the detector circuits and software that he has written for the virtual instruments described above.
All written documentation and schematic diagrams, may be freely used or copied by others, for noncommercial distribution, for scientific study purposes, but must retain the name of the author: Tony Devencenzi, and this notice.
The virtual instrument software was written on the Abacom Profilab Expert 4.0 platform. The software was then compiled and will function as a legal and copyable, stand alone, run-time application, Copyright (c) 2009 Tony Devencenzi. It will run on Windows XP, ME, Win2000 and Vista. The compiled files have been compressed into an executable installer file. (An uninstaller is also present). The author, Tony Devencenzi, hereby gives permission to freely copy this software and distribute (at no charge) to others, for scientific research and educational use.
See bottom of this page to download author's research schematic diagrams, construction notes, software and complete documentation.
Mr. Gregory Hodowanec who's work is mentioned here, along with the capacitor detector configuration that he originated, did not participate in this research project. He is mentioned out of repect for him and with appreciation for the discovery that he made, which has provided a valuable resource in this endevour.
Disclaimer: This information and any supporting software or documentation, is presented only for educational use and purposes of scientific study and is theory and opinion of the author. No claim as to suitability for any other purpose is given. No responsibility for any injury, damage or loss resulting from use or misuse, is assumed by the author.
EXPERIMENT 3/20/2011:
Detection of Aether-Magnetic Solar and Galactic Energy Waves.
New Aether-Magnetic Detector experiment reveals more about wave structure and possible solar and galactic origin of waves:
In order to learn more about the nature of the detected waves over time, the following experimental setup was used:
Two aether-magnetic detector circuits were constructed:
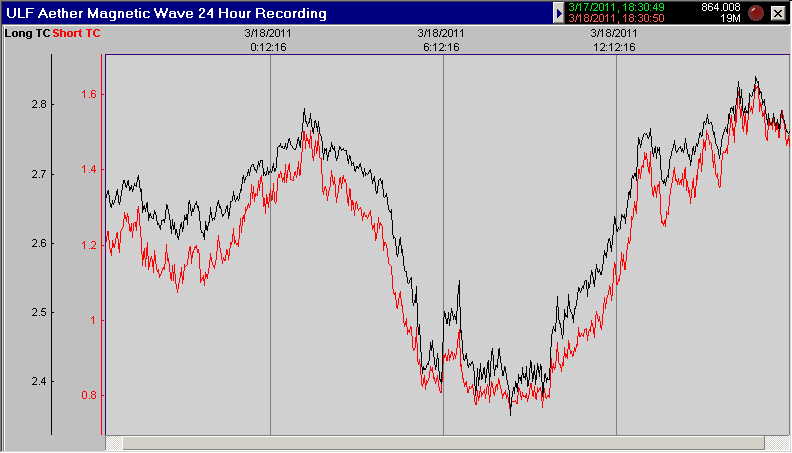
One detector circuit was identical to the one used in experiments 11 through 13 (LF444ACN IC, 10UF integrator capacitor, 50 watt transformer, etc), and with a fixed secondary amplifier gain of 17
(Gain was changed from 7 to 17 on 9/20/2011 to give a reading more in balance with the Long TC circuit). This is a short time constant circuit which will capture brief events as well as very long fluxuations of energy. For the purposes of this experiment, we will call this variation, the "Short TC Detector".
The second detector circuit was very similar, with these differences: circuit used an LF347 IC, a 1000UF integrator capacitor and had a fixed secondary amplifier gain of 17. This is a long time constant circuit that is more or less immune to brief localized magnetic events but will capture long fluxuations. For the purposes of this experiment, we will call this variation, the "Long TC Detector".
Both detector outputs were fed to the same (two channel) Velleman VM-110 interface as used in previous experiments.
In this setup the software that was used was not one of the author's compilations as used before, but was a software chart recorder made by Abacom, called RealView 3.0. This product is an excellent chart recorder with an almost unlimited potential recording length. It will work with a number of analog to digital converters including the Velleman VM-110 used before. (This software may be purchased from Abacom.com in Germany directly, or in the US may be ordered from Saelig Inc.)
The RealView software chart recorder does not have software math blocks such as the mean-value soft-components used in the author's own compilations, however it does have a "smoothing" feature adjustable for each channel. This feature was set to "Heavy" smoothing for both channels. The sample rate was set for 100mS per sample.
The apparatus was positioned so that both detector transformers were facing East-West with respect to their lamination flat sides.
This setup was allowed to record for a 24 hour period. Note: 24 hours at a sample rate of 100mS takes about 19 megs of hard disk space per recording. (Use a slower sample rate for smaller files).
The recording time measure used in these recordings is UTC or UT (Universal Time). This corresponds to 24 hour time plus 8 hours (to correct for Pacific Standard Time).
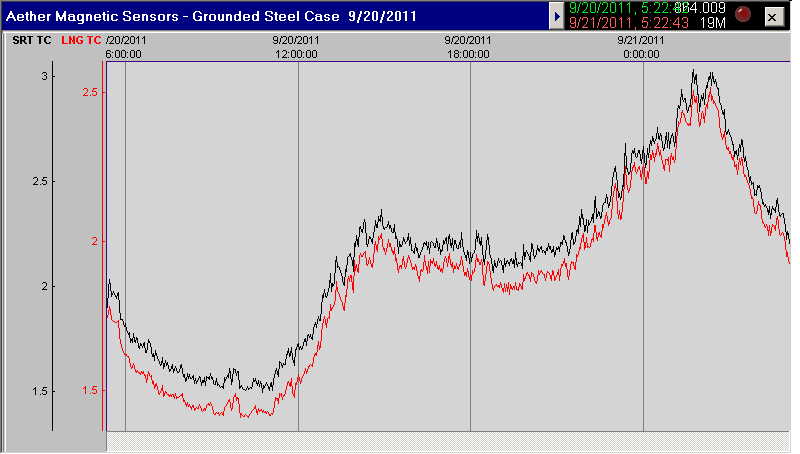
After recording for 24 hours and compressing the recording into a single page. A rough sine like wave was seen with highs at sunset and sunrise. This test was done for a number of different 24 hour periods. In the chart below, a spike between 6:00 and 7:00 UTC can also be seen.
Both the Long TC Detector and the short TC Detector tracked each other very well, with slight variations due to the different time constants used.
It is currently believed that most of this aether-magnetic wave activity is from the sun but some is from other galactic sources, which during the night time hours, unobstructed by the sun's day time ionospheric influence, is allowed through in greater levels.
Please download diagrams for the detectors at the bottom of this web page. For general construction information, download construction notes and read those for the Aether-Magnetic Detector circuit (observing differences in the schematic diagrams).
For those readers who wish to build a simplified version of this apparatus, you may build a single channel version and choose either a short TC or long TC circuit.
Minor Variation 9/20/11:
This is a repeat of the last experiment, made six months later.
This time beside using shielded transformers, with each shield grounded, the entire assembly was installed in a grounded steel case.
This makes the transformers double shielded.
As you can see from the chart below, the 24 hour ULF wave still is detected.
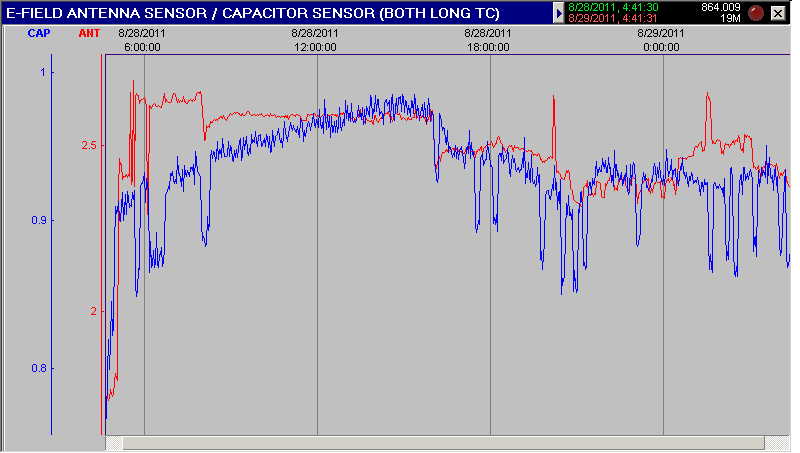
EXPERIMENT 8/29/11:
Detection of ULF Modulation of Electrical and Scalar Energy Fields.
This is an updated version of Experiment 9.
Experiment 9 recorded two detector types, one a Hodowanec type Capacitor, the other the E-Field / Antenna sensor. The sensors were connected to a Velleman VM-110 interface and a simple PC based chart recorder was used. Waveforms, measured over seconds and minutes, were seen at least partially tracking each other.
In order to learn more about the nature of the detected waves over longer period of time, the following experimental setup was used:
Two new updated and simplified sensors were built, one Hodowanec Effect Capacitor sensor and one E-Field Effect Antenna sensor. Download the diagrams for these sensors at the bottom of this page: "Cap Sensor 8/11" "E-Field Sensor 8/11".
Both of these sensors are similar to the "Long TC Detector" circuit used in the last experiment (3/11). Instead of a transformer, one uses a capacitor and the other an antenna.
The E-Field Antenna sensor circuit used an LF347 IC, a 1000UF integrator capacitor and had a fixed secondary amplifier gain of 17.
The Capacitor sensor circuit also used an LF347 IC, a 1000UF integrator capacitor but had a fixed secondary amplifier gain of about 55.
Both detector outputs were fed to the same (two channel) Velleman VM-110 interface as used in previous experiments.
In this setup, like the last experiment (3/11) the software that was used was not one of the author's compilations, but was a software chart recorder made by Abacom, called RealView 3.0. This product is an excellent chart recorder with an almost unlimited potential recording length. It will work with a number of analog to digital converters including the Velleman VM-110 used before. (This software may be purchased from Abacom.com in Germany directly, or in the US may be ordered from Saelig Inc.)
The RealView software chart recorder does not have software math blocks such as the mean-value soft-components used in the author's own compilations, however it does have a "smoothing" feature adjustable for each channel. This feature was set to "Heavy" smoothing for both channels. The sample rate was set for 100mS per sample.
The circuitry was enclosed in a grounded steel box to shield it from electro- magnetic influences.
This setup was allowed to record for a 24 hour period. Note: 24 hours at a sample rate of 100mS takes about 19 megs of hard disk space per recording. (Use a slower sample rate for smaller files).
The recording time measure used in these recordings is UTC or UT (Universal Time). This corresponds to 24 hour time plus 8 hours (to correct for Pacific Standard Time).
During the recording, the two waveforms were seen to track each other part of the time, observing the traces in real time.
After recording for 24 hours and compressing the recording into a single page (as shown below), each waveform has its own distinct trace and does not continually track the other, however there are a number of instances where spikes, dips, or other activity, of the two traces, are obviously related.
Some very small pulses on the E-Field trace, are the author's air conditioning going on and off (time frame 21:00 to 00:00), but the large pulses may be from solar related electron storms in space, as some seem to track the NASA/NOAA site GOES satillite charts.
The Capacitor trace seems to peak around sunrise and may be solar related as well. Gregory Hodowanec believes that the activity detected by his capacitor detector, is caused by gravity waves. Whatever it is, this energy penatrates steel shielding.
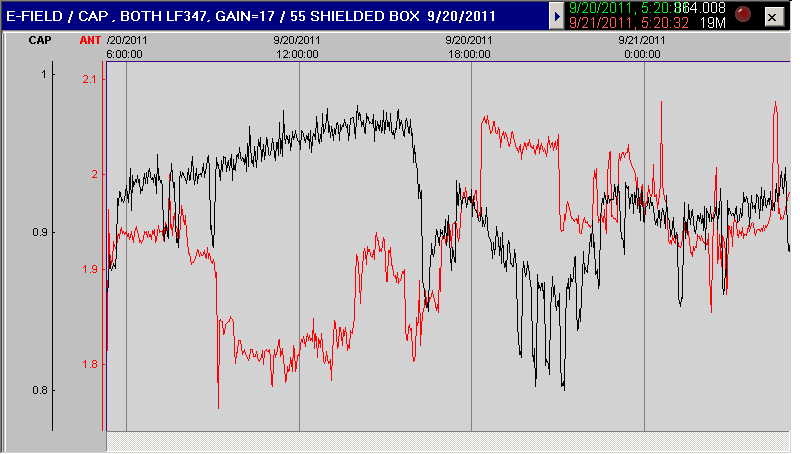
The chart below is a repeat of the last experiment performed a few weeks later (9/20/11).
All components and settings are the same.
Comparing the two charts, the Capacitor sensor traces are similar, while the E-Field traces are not.
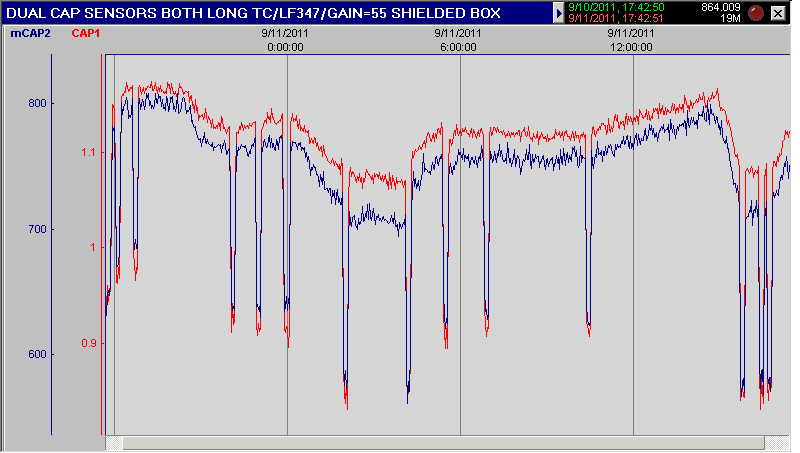
EXPERIMENT 9/10/11:
Dual Detection of ULF Modulation of Scalar Energy.
This is an updated version of Experiment 4.
Experiment 4 recorded two identical sensors of the Hodowanec Effect type Capacitor Detector. The sensors were connected to a Velleman VM-110 interface and a simple PC based chart recorder was used. Waveforms, measured over seconds and minutes, were seen fairly closely tracking each other.
In order to learn more about the nature of the detected waves over longer period of time, the following experimental setup was used:
Two new updated and simplified sensors were built, both were identical Hodowanec Effect Capacitor sensors. Download the diagram for these sensors at the bottom of this page: "Cap Sensor 8/11".
These sensors are the same as the capacitor sensor circuit used in the last experiment (8/11)
The Capacitor sensor circuit uses an LF347 IC, a 1000UF integrator capacitor and has a fixed secondary amplifier gain of about 55.
Both detector outputs were fed to the same (two channel) Velleman VM-110 interface as used in previous experiments.
In this setup, like the last experiment (8/11) the software that was used was a chart recorder made by Abacom, called RealView 3.0.
The RealView software chart recorder has a "smoothing" feature adjustable for each channel. This feature was set to "Heavy" smoothing for both channels. The sample rate was set for 100mS per sample.
The circuitry was enclosed in a grounded steel box to shield it from electro-magnetic influences.
This setup was allowed to record for a 24 hour period.
The recording time measure used in these recordings is UTC or UT (Universal Time).
The two waveforms were seen to track each almost perfectly, over the long term.
The trace seems to peak around sunrise and may be solar related. The large negative spikes are of unknown origin.
This dual sensor test, proves that the recorded waves are not the product of random circuit generated noise.