2015-2016 Research
Page 2 of 9
MatLab
At the time of
writing this is the current version of the script we are using.
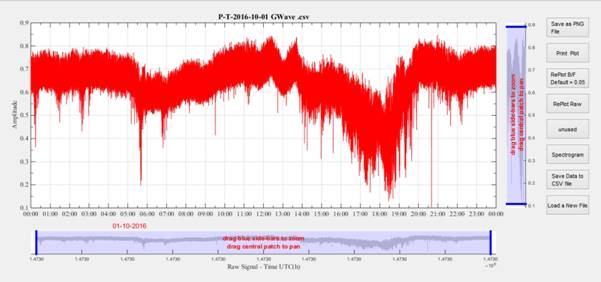
The options we
have are, X&Y panning, save plot as a PNG file, print plot, RePlot raw
data, create a Spectrogram, Save modified data to a CSV file and load a new
file.
The create a Spectrogram and save modified data to a CSV file options
are only available when using a single data set.
The X&Y
panning and save image to a PNG file scripts are scripts from the MatLab file
exchange library.
MatLab File
Exchange Library URL
http://uk.mathworks.com/matlabcentral/fileexchange/
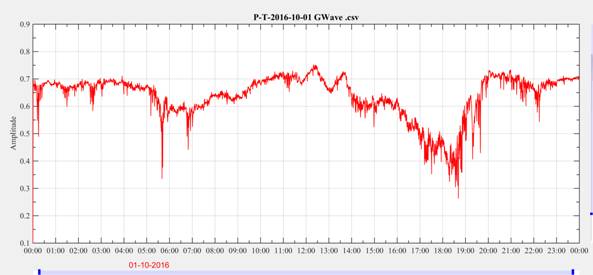
Butterworth Filter
applied to data and image saved with the Save to PNG file option
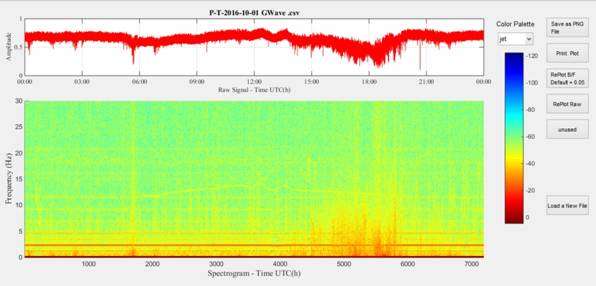
Spectrogram Image