2015-2016 Research
Page 1 of 9
Hardware and Software Improvements
We have been
putting most of our effort into improving the hardware and better analysis of
the data.
It was realised
early on that our pervious methods of using a visual method of aligning 2
images and overlaying them was not suitable. We also wanted to be analyze some
or our data down to a second or tenths of a second to check for event matchups.
To this end we created scripts in MatLab and spread sheets in Excel to achieve
this. These scripts and spread sheets are under constant development as we
realise we want to add more options to them.
Hardware updates
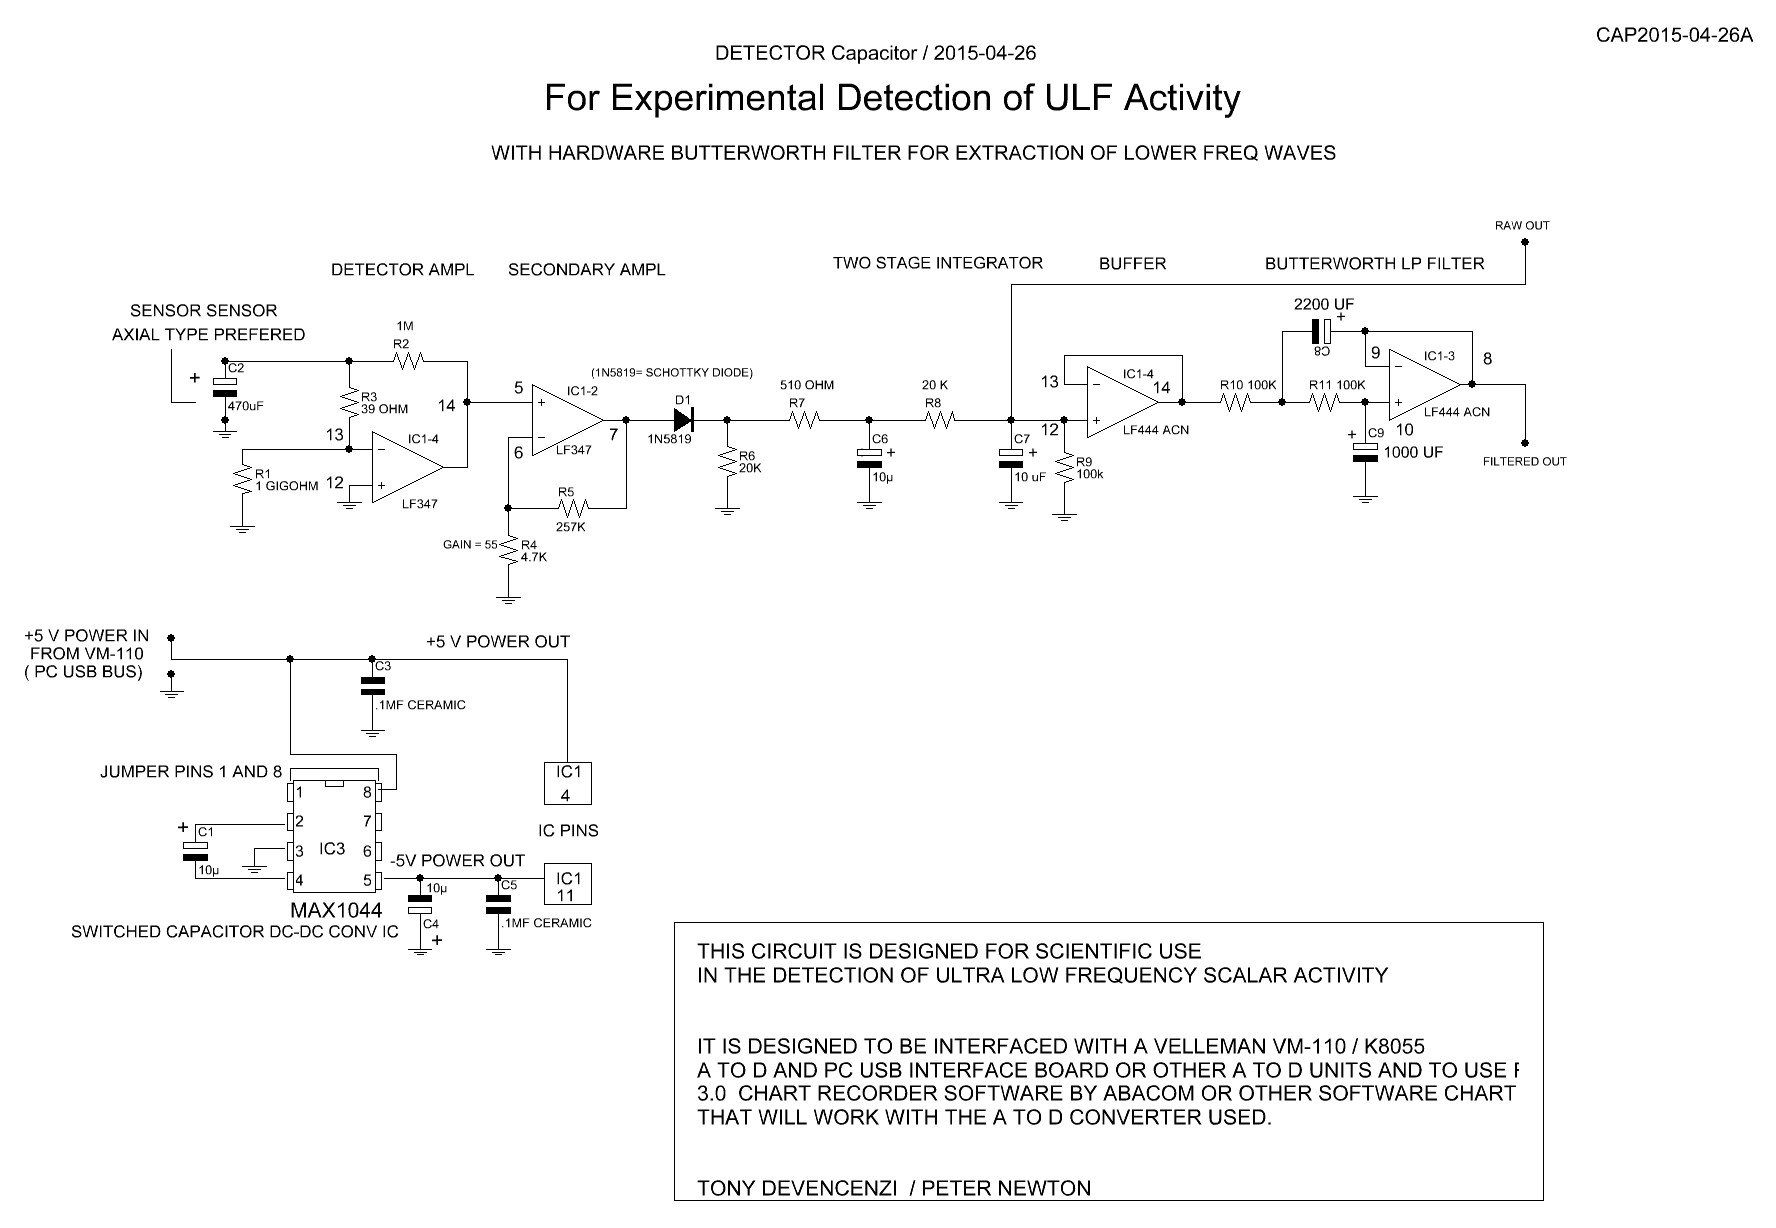
Hardware Butterworth Filter
Due to the success
we were having with the software Butterworth Filter in cleaning up cluttered
data like we are getting from the Capacitor sensor, Tony decided to design a
Hardware Butterworth filter with results that match the software Butterworth
filter.
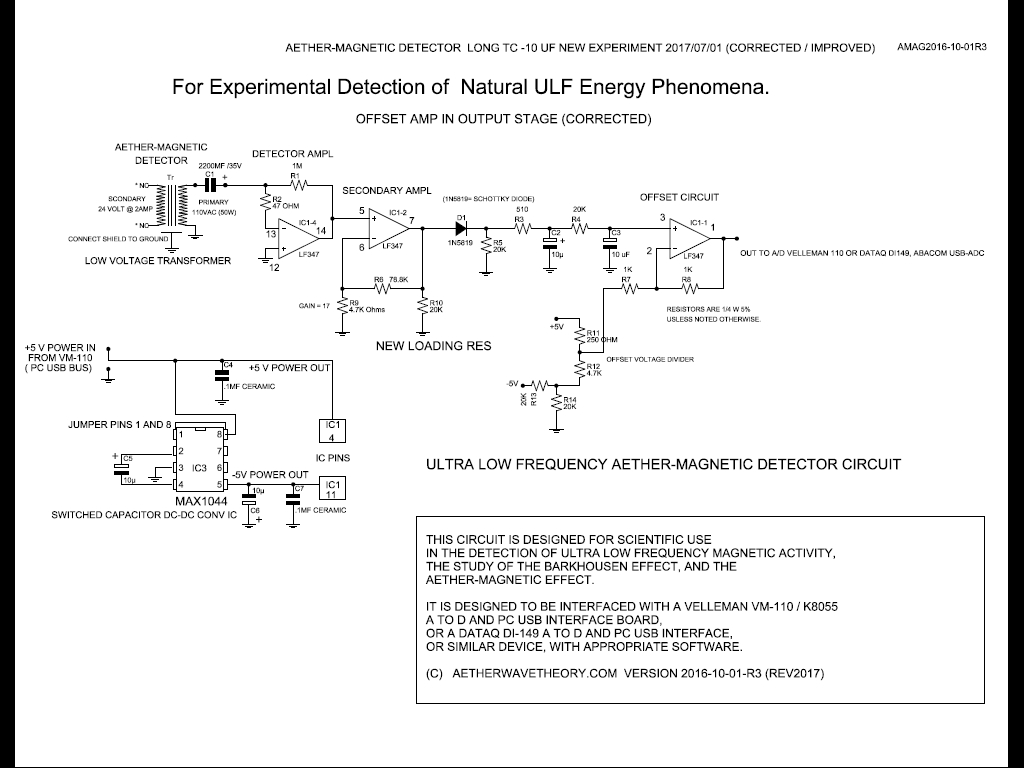
Improved Output Aether-Magnetic Sensor
This version of the Aether-Magnetic sensor
has an offset circuit on it's output to reduce the offset voltage that this sensor normally
produces, by about one volt.
Software Analysis Updates
MatLabs Scripts
Peter has been working with software methods to process and
our sensor data, for better analysis. Primarily working with custom scripts written for MatLab and Excel spread sheets. At the time of
writing this is the current version of the script.
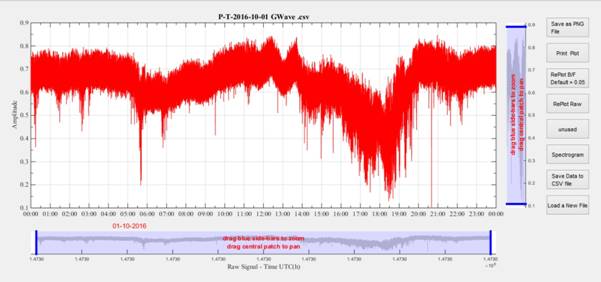
Some of the
options are X&Y panning and save image to a PNG file both curtsey of
scripts from the MatLab file exchange library. Other options are print image,
apply a Butterworth filter and re-plot raw data. When using a single data set
you have the options to create a Spectrogram and export the modified data to a
CSV file. This script will work on up to a maximum of 6 data set.
MatLab have an
option that the script can be compiled to an exe file.
MatLab File
Exchange Library URL
http://uk.mathworks.com/matlabcentral/fileexchange/
Excel Spread Sheets
At the time of
writing this is the current version of the spread sheet we are using.
Further Improvements
Find sources of
other data we can import into out charts to compare against.
Further develop
the current sensors and develop new sensors.
Further develop
the scripts and spreadsheets and look for new analysis software.
look into putting
a sensor on the web in near live time.