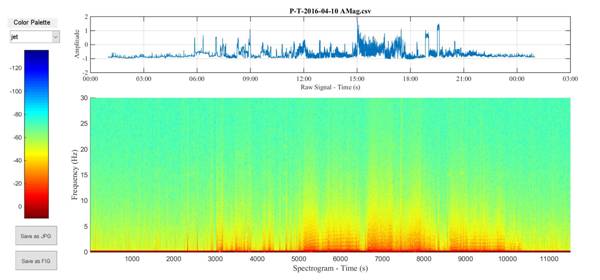
One of the options that is on the MatLab
compiles program to create a spectrogram of a single data set. This option is
only available when using a single data set and is a button on the menu bar on
the right hand side.
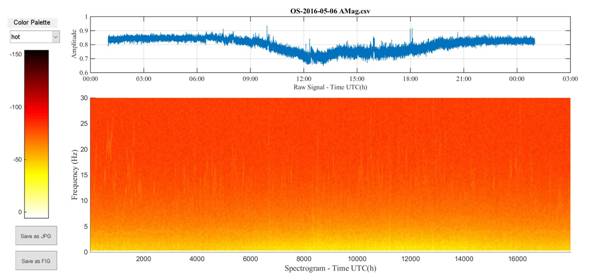
We have seen different results when using
this option. One thing we see often is a ribbon effect in the spectrogram. I
have seen this before on spectrogram when using an aerial located outside
caused by the wind. We are using a small transformer located inside.